Chapter 2: Business Analytics in End-to-End Processes and Workflows
Here's a scene playing out in boardrooms across the world right now: An analytics team presents a beautiful dashboard. Executives nod appreciatively. Someone asks a clarifying question. The presentation ends with "great work" and "let's schedule a follow-up." Then everyone goes back to making decisions exactly as they did before.
This is analytics theater—the performance of being data-driven without actually changing anything.
The fundamental mistake most organizations make is treating analytics as a separate function, a support service, or worse, a reporting department. They build analytics teams that sit outside core business processes, producing insights that arrive too late, answer questions nobody asked, or require so much interpretation that decision-makers simply ignore them.
The brutal truth: If your analytics isn't embedded directly into the workflows where decisions happen, it's decorative.
This chapter is about killing the analytics theater and building something real: analytics that lives inside your business processes, changes decisions in real-time, and proves its value through measurable business outcomes.
2.1 Business Processes and Value Streams
What Actually Happens in Your Business
Before we can embed analytics anywhere, we need to understand where decisions actually happen. Not where org charts say they happen, but where they really occur .
Every business has core value streams —the end-to-end processes that create and deliver value to customers. These aren't departmental activities; they're cross-functional flows that typically include:
- Order-to-Cash (O2C): Customer places order → fulfillment → delivery → payment collection
- Procure-to-Pay (P2P): Identify need → supplier selection → purchase → payment
- Hire-to-Retire (H2R): Workforce planning → recruitment → onboarding → development → separation
- Concept-to-Launch (C2L): Idea generation → development → testing → market introduction
- Lead-to-Revenue (L2R): Marketing generates lead → qualification → sales conversion → customer success
Each value stream contains dozens or hundreds of decision points. Most are small, operational decisions made dozens of times per day. A few are strategic decisions made quarterly or annually. Analytics that matters lives at these decision points.
The Two Types of Decisions That Actually Matter
Let's be precise about what we mean by "decisions":
Type 1: Operational Decisions (High frequency, lower stakes individually) - Should we approve this credit application? - Which warehouse should fulfill this order? - Is this transaction fraudulent? - Should we reorder this SKU today? - Which customer service ticket needs attention first?
These happen hundreds or thousands of times daily. Individually they're small. Collectively they define your business performance. This is where analytics creates the most value—but most analytics teams ignore these decisions entirely.
Type 2: Strategic Decisions (Low frequency, higher stakes individually) - Should we enter a new market? - Which product features should we prioritize? - Should we acquire this company? - How should we restructure our supply chain? - What's our pricing strategy for next year?
These get all the attention—the consulting projects, the executive presentations, the sophisticated modeling. Yet they represent a tiny fraction of decisions made and often a smaller fraction of value created.
The Analytics Opportunity Map
Here's an uncomfortable exercise: Map every recurring decision in your order-to-cash process. Every single one. You'll likely find 30-50 decision points. Now ask: which of these decisions use data? Which use predictive analytics? Which are automated?
For most organizations, the honest answers are: some, almost none, and very few.
That gap between "decisions that could use analytics" and "decisions that actually use analytics" is where your competitive advantage is hiding.
Companies like Amazon don't just have better data or smarter analysts. They've systematically embedded analytics into every decision point in their value streams. Pricing decisions happen millions of times per day using algorithmic optimization. Inventory decisions are automated using demand forecasting. Warehouse routing is continuously optimized. Fraud detection happens in real-time. Customer recommendations adapt instantly.
The question isn't whether Amazon has more data than you (they probably do). The question is: what percentage of their decisions are analytics-enabled versus what percentage of yours are?
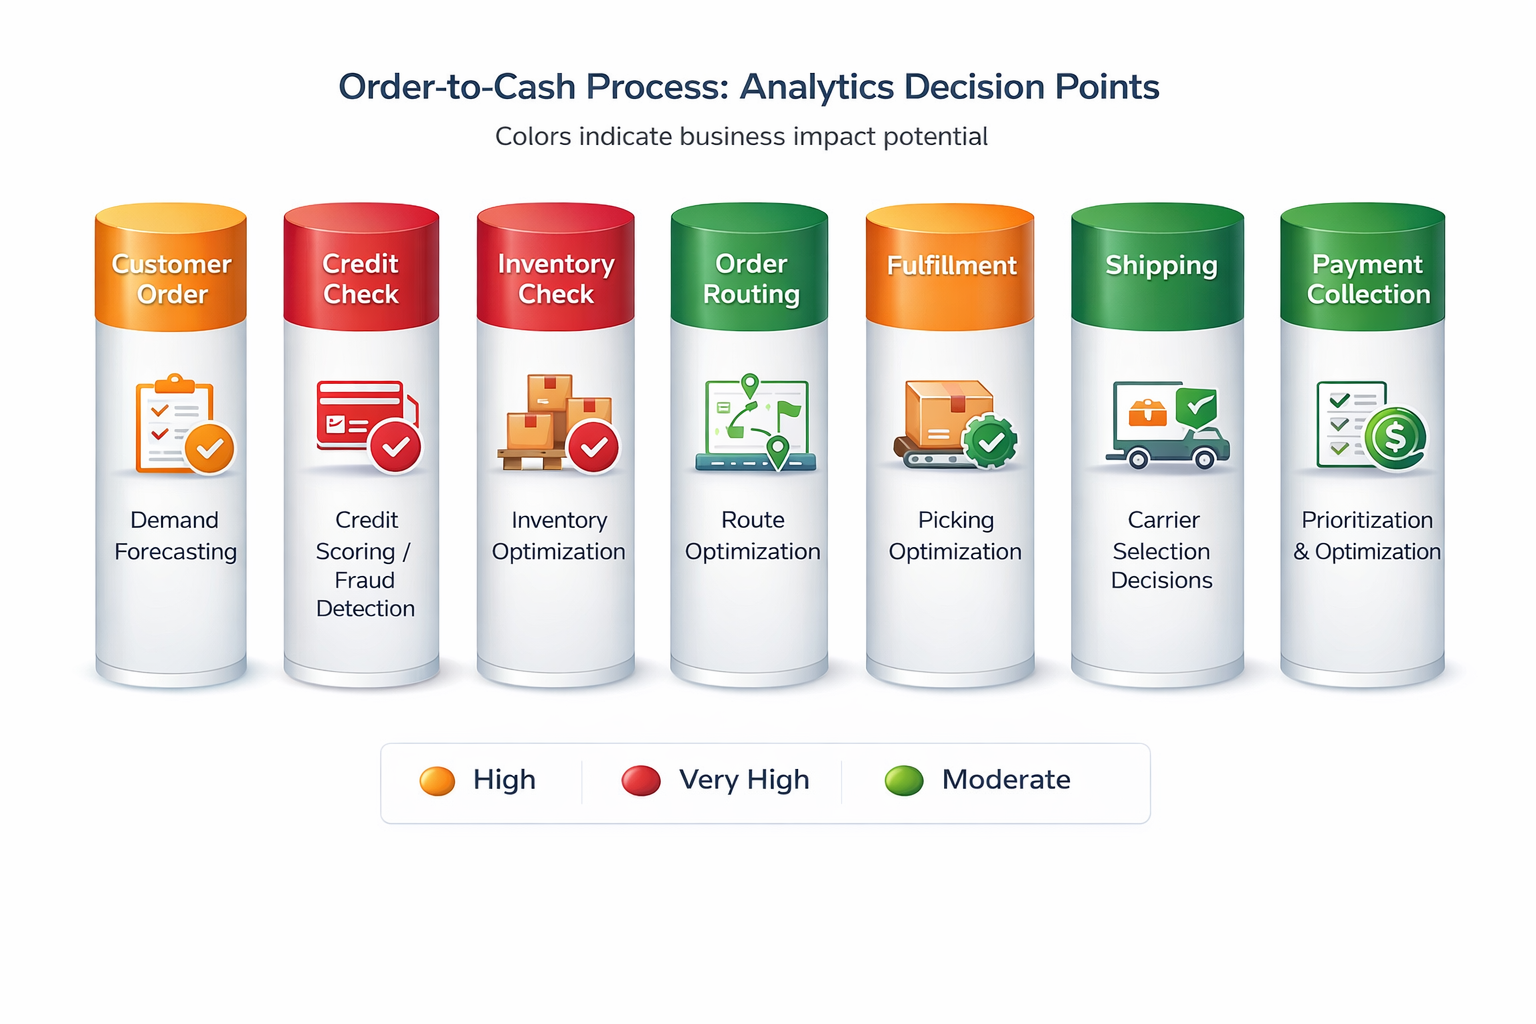
DIAGRAM 1: Order-to-Cash Analytics Decision Points This diagram maps the typical Order-to-Cash process with analytics opportunities at each decision point. Color coding indicates business impact potential (red = very high, orange = high, green = medium). Notice how every single step contains opportunities for analytics to improve decisions.
2.2 Embedding Analytics in Core Functions
Let's get specific. What does embedded analytics actually look like in different business functions? And more importantly, what does failure look like?
2.2.1 Marketing and Customer Analytics
The Theater Version
Marketing teams love dashboards. They love metrics. They love reporting on campaign performance after the campaign ends. They love discussing "insights" in meetings.
Here's what this looks like in practice: - Weekly marketing meetings reviewing last week's performance - Monthly reports showing campaign metrics and conversion rates - Quarterly analysis of customer segments and trends - Annual strategic planning informed by last year's data
Notice the pattern? Everything is backward-looking. Everything is reported after decisions are made and money is spent.
The Real Version
Embedded marketing analytics makes decisions, doesn't just report on them.
Example: ShopCo vs. MarketGenius
ShopCo (The Theater Version): - Marketing team runs a promotional campaign - Spends $100K over two weeks - Analytics team produces a report three weeks later showing which customer segments responded - Marketing team says "interesting, we'll consider this for next time" - Next campaign: they do basically the same thing
MarketGenius (The Embedded Version):
- Marketing team designs campaign framework and budget
- Real-time bidding algorithms adjust spend by channel, audience, time of day based on conversion data
- Customer lifetime value (CLV) predictions determine how much to bid for each customer segment
- Campaign automatically shifts budget to high-performing variants within hours
- Propensity models identify which existing customers to suppress (because they'd buy anyway)
- Post-campaign analysis measures incremental impact using holdout groups
The difference? MarketGenius has analytics embedded in the decision workflow. Thousands of micro-decisions (bid on this ad placement? target this customer?) are made algorithmically. The analytics doesn't just inform the campaign—it runs the campaign.
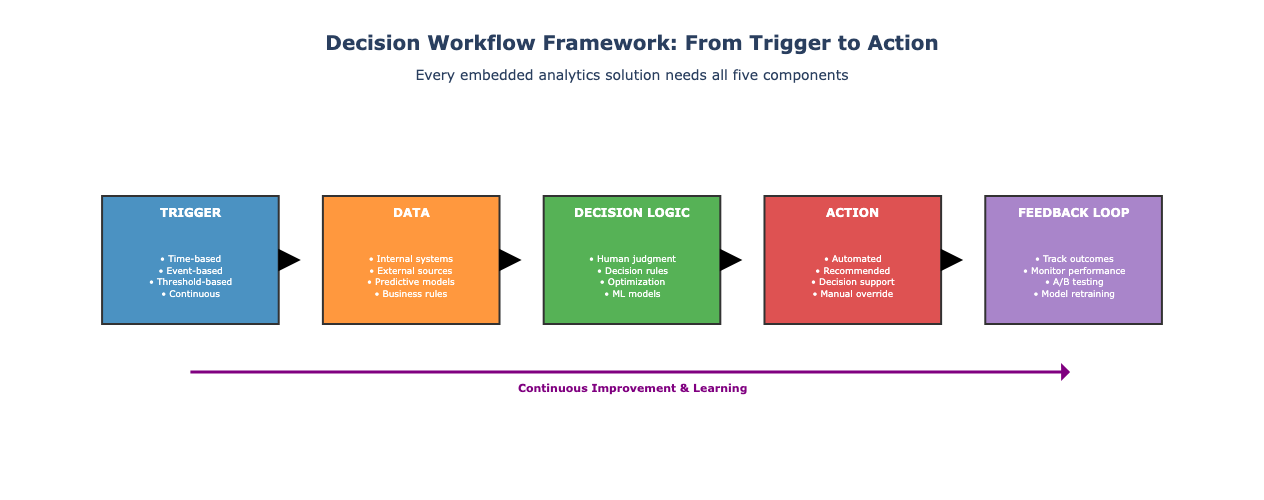
DIAGRAM 2: Decision Workflow Framework This framework shows the five essential components of every embedded analytics solution: Trigger (what initiates the decision), Data (what information is needed), Decision Logic (how the decision is made), Action (what happens), and Feedback Loop (how we learn and improve). The purple arrow represents continuous learning—outcomes feed back to improve future decisions.
Key Analytics Embedded in Marketing Workflows
- Customer Segmentation Models → Used in real-time targeting decisions
- Propensity Scoring → Determines who receives which message
- Next-Best-Action Engines → Recommends optimal customer interaction
- Attribution Models → Allocates budget across channels based on actual incremental impact
- CLV Predictions → Sets acquisition cost thresholds and retention investment levels
Notice these aren't reports. They're decision engines embedded in operational workflows.
2.2.2 Operations and Supply Chain Analytics
The Theater Version
Operations teams produce impressive-looking metrics: on-time delivery rates, inventory turns, capacity utilization, defect rates. These get reviewed in operations meetings and reported to executives.
Then everybody goes back to managing operations the way they always have—using experience, gut feel, and simple heuristics.
The Real Version
Embedded operations analytics automates or transforms operational decisions.
Example: Amazon's Fulfillment Network
Amazon's operations analytics isn't a reporting function—it's the operating system:
- Inventory Placement: Algorithms predict demand by geography and pre-position inventory across fulfillment centers before customers order
- Route Optimization: Delivery routes are optimized in real-time considering traffic, weather, package characteristics, and driver schedules
- Dynamic Slotting: Warehouse product placement changes continuously based on demand patterns
- Predictive Maintenance: Equipment sensors trigger maintenance before failures occur
- Capacity Planning: Forecasts drive hiring, facility expansion, and capital investments months ahead
The operations team doesn't receive weekly reports on these topics. Analytics is the operations.
Key Analytics Embedded in Operations Workflows
- Demand Forecasting → Drives inventory replenishment decisions automatically
- Route Optimization → Determines actual delivery routes daily
- Predictive Maintenance → Triggers work orders based on failure probability
- Quality Prediction → Flags potential defects before they reach customers
- Capacity Modeling → Determines staffing levels and shift schedules
The test of embedded analytics: Can the operation run without human intervention? Not should it, but can it? If your analytics is truly embedded, the answer is increasingly yes.
2.2.3 Finance, Risk, and Pricing Analytics
The Theater Version
Finance teams are drowning in reports. Monthly financial statements, variance analyses, budget tracking, forecasts, board packages. They spend weeks closing the books, analyzing what happened last month, and explaining variances.
Meanwhile, critical financial decisions—pricing, credit approvals, investment allocation—happen based on policies set years ago or judgment calls made under time pressure.
The Real Version
Embedded finance analytics moves from explaining the past to optimizing the future.
Example: Dynamic Pricing
Traditional Approach (RetailCo):
- Pricing team sets prices quarterly based on cost-plus targets
- Occasionally runs promotions based on calendar (holidays, end of season)
- Analyzes sales after promotions end to assess effectiveness
- Makes modest adjustments next quarter
Embedded Approach (PriceSmart):
- Base prices set strategically by category
- Dynamic pricing engine adjusts prices continuously based on:
- Competitor prices (monitored in real-time)
- Inventory levels and age
- Demand elasticity by customer segment
- Cross-product effects (what else do buyers of product A purchase?)
- Time-based patterns (day of week, time of day, seasonality)
- Revenue management models balance volume and margin
- A/B testing runs continuously to refine pricing algorithms - Promotions are targeted and personalized based on customer propensity models
RetailCo's pricing team spends time on analysis. PriceSmart's pricing team spends time improving the pricing algorithms. The actual pricing decisions happen thousands of times per day without human intervention.
Key Analytics Embedded in Finance Workflows
- Credit Scoring Models → Automate credit approval decisions
- Fraud Detection → Flag or block suspicious transactions in real-time
- Dynamic Pricing → Adjust prices based on demand, inventory, competition
- Cash Flow Forecasting → Predict liquidity needs and optimize working capital
- Profitability Analytics → Measure contribution margin by customer, product, channel in near-real-time
2.2.4 HR and People Analytics
The Theater Version
HR produces engagement survey results. Turnover reports. Diversity dashboards. Time-to-fill metrics for recruiting. All reviewed in quarterly business reviews and promptly forgotten.
The actual decisions—who to hire, who to promote, how to allocate compensation, where to invest in development—remain largely subjective, political, and inconsistent.
The Real Version
Embedded people analytics transforms talent decisions from subjective to systematic.
Example: Flight Risk and Retention
Theater Approach (TalentCorp):
- Annual engagement survey
- HR analyzes results and presents to leadership
- Turnover report shows who left last quarter
- Exit interviews reveal why (maybe)
- HR recommends "improving culture" and "better manager training"
Embedded Approach (TalentOptima):
- Flight risk model scores all employees monthly using:
- Engagement data
- Performance trajectory
- Compensation relative to market
- Manager quality indicators
- Career progression patterns
- External labor market conditions
- High-risk employees trigger automated workflows:
- Manager receives alert with specific retention actions
- Compensation team reviews pay positioning
- Career development conversations scheduled
- Stay interviews conducted proactively
- Retention interventions A/B tested to measure effectiveness
- Model continuously refined based on who actually leaves
TalentCorp explains turnover after it happens. TalentOptima prevents it before it occurs.
Key Analytics Embedded in HR Workflows
- Predictive Hiring Models → Screen candidates and predict performance
- Flight Risk Scores → Identify retention risks before resignation
- Performance Prediction → Identify high-potential employees early
- Compensation Analytics → Ensure pay equity and market competitiveness
- Skills Gap Analysis → Drive targeted development and hiring
2.3 Decision Workflows: From KPIs to Actions
Now we get to the heart of the matter: decision workflows . This is where most analytics initiatives fail.
The Broken Pattern
Here's the typical flow in most organizations:
- Data gets collected (sometimes)
- Data gets stored (somewhere)
- Data gets analyzed (eventually)
- Insights get presented (in meetings)
- People nod (politely)
- Nothing changes (predictably)
The problem isn't the first four steps—most organizations do these reasonably well. The problem is the chasm between insight and action.
The Decision Workflow Framework
A real decision workflow has five components:
1. Trigger: What initiates the decision?
- Time-based (weekly inventory review)
- Event-based (customer submits order)
- Threshold-based (inventory drops below minimum)
- Continuous (algorithmic trading)
2. Data: What information is needed?
- Internal data (systems of record)
- External data (market conditions, weather, competitors)
- Predictive outputs (forecast, risk score, propensity)
- Constraints (policies, regulations, capacity limits)
3. Decision Logic: How is the decision made?
- Human judgment (review and decide)
- Decision rules (if-then logic)
- Optimization (maximize objective function)
- Machine learning (pattern-based prediction and decision)
4. Action: What happens?
- System action (automated)
- Recommended action (human approves)
- Decision support (information provided, human decides)
5. Feedback Loop: How do we learn?
- Decision outcomes tracked
- Model performance monitored
- A/B testing of decision rules
- Continuous improvement process
Example: Inventory Replenishment Decision Workflow
Let's make this concrete with a common operational decision.
Theater Version (BasicRetail):
-
Trigger:
Weekly inventory review meeting
-
Data:
Current inventory levels report (printed)
-
Decision Logic:
"Looks like we're running low on widgets, better order some"
-
Action:
Someone emails a purchase order to the supplier
-
Feedback:
None systematic (maybe they run out or have too much)
Embedded Version (SmartRetail):
-
Trigger:
Continuous monitoring, reorder triggered when inventory projection hits reorder point
-
Data:
- Current inventory levels (real-time)
- Demand forecast (next 14-30 days by SKU)
- Lead time from supplier (historical distribution)
- Current pricing and promotions
- Seasonality patterns
- Supplier capacity and delivery schedules
-
Decision Logic:
- Optimization model minimizes total cost (holding + ordering + stockout)
- Considers demand uncertainty using forecast confidence intervals
- Accounts for economies of scale in ordering
- Respects warehouse capacity constraints
- Action:
- Automated: Generate purchase order for optimal quantity and timing
- System submits order to supplier via API
- Inventory planner receives notification to review exceptions
- Feedback:
- Forecast accuracy tracked by SKU
- Stockout incidents recorded
- Order costs and delivery performance measured
- Model retrained monthly with new data
The difference? BasicRetail makes maybe 50 inventory decisions per week with high variance in quality. SmartRetail makes thousands of inventory decisions per week with consistently optimal logic. The compound effect over a year is massive.
2.4 Dashboards, Reports, and Alerts in Operational Decision-Making
Let's talk about dashboards. Most of them are useless.
The Dashboard Delusion
Organizations spend enormous amounts of money building dashboards. Executive dashboards. Operational dashboards. Real-time dashboards. Self-service BI platforms. The dashboard industry is worth billions.
Yet study after study shows that most dashboards are rarely viewed. And when they are viewed, they rarely change decisions.
Why? Because dashboards are fundamentally passive. They present information and hope someone does something with it. Hope is not a strategy.
The Three Types of Analytics Outputs
Not all analytics outputs are created equal. They fall into three categories, ranked by impact:
Tier 3: Reports and Dashboards (Passive)
- Purpose: Inform and monitor
- User Action Required: High—user must interpret, decide what to do, and take action
- Impact: Low—because most of the time, nobody does anything
- Appropriate Use: Strategic monitoring, exploratory analysis, transparency
Tier 2: Alerts and Recommendations (Active)
- Purpose: Direct attention and suggest action
- User Action Required: Medium—user must approve and execute
- Impact: Medium—higher than passive dashboards because they're actionable
- Appropriate Use: Exception management, decision support, quality control
Tier 1: Automated Decisions and Actions (Embedded)
- Purpose: Make decisions and take action
- User Action Required: Low—human oversight and exception handling only
- Impact: High—because decisions actually happen consistently and optimally
- Appropriate Use: High-frequency operational decisions with clear objectives
The hierarchy is clear: Automate where you can. Alert where you must. Report only what's left.
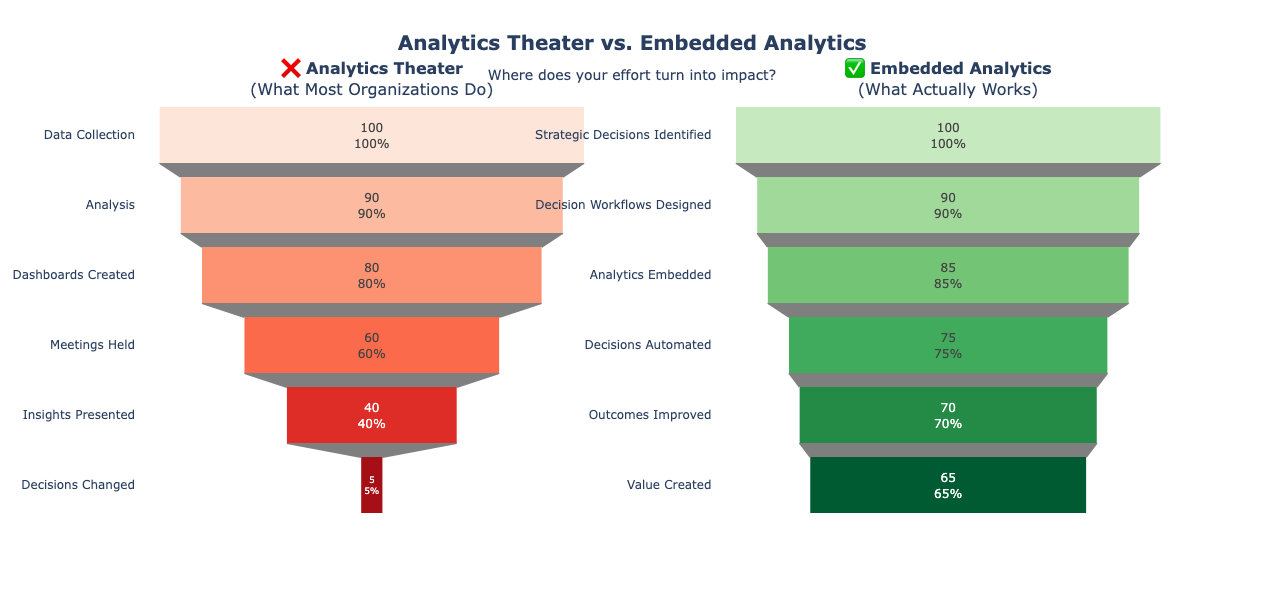
DIAGRAM 3: Analytics Theater vs. Embedded Analytics This visual comparison shows the dramatic difference between analytics theater (left) and embedded analytics (right). Theater organizations invest heavily in data collection and analysis but see minimal impact on actual decisions. Embedded analytics organizations maintain focus through the entire value chain from strategy to measurable value creation. Notice the stark difference in conversion rates to actual business outcomes.
When Dashboards Actually Work
Dashboards have legitimate uses, but they're narrower than most people think:
Good Dashboard Use Cases:
1.
Executive monitoring of strategic KPIs
(monthly review of business health)
2.
Operational monitoring of real-time systems
(website performance, system health)
3.
Exploratory analysis
(data scientists investigating patterns)
4.
Transparency and communication
(sharing results with stakeholders)
Bad Dashboard Use Cases:
1.
Replacing decision systems
("Just give them a dashboard and let them figure it out")
2.
Substituting for automated alerts
(expecting people to monitor dashboards constantly)
3.
Avoiding the hard work of defining decision logic
("We'll build self-service BI")
Alerts: The Middle Ground
Alerts are better than dashboards because they're proactive. Instead of hoping someone checks a dashboard, alerts push information when it matters.
Effective Alert Characteristics:
-
Actionable:
Clearly indicate what the recipient should do
-
Timely:
Arrive when action is still possible
-
Specific:
Include relevant context and data
-
Prioritized:
High-value items surfaced first
-
Tuned:
False positive rate low enough that people don't ignore them
Example: Sales Alert System
Bad Alert: "Customer X's engagement score dropped 15% this month"
Good Alert:
"URGENT: Customer X (Annual Value: $2.3M, Renewal: 45 days) showing cancellation risk signals:
- Usage down 40% vs. last quarter
- Support tickets up 3x (product quality issues)
- Key champion left the company (LinkedIn)
Recommended actions:
1. Executive sponsor call this week (calendar invite attached)
2. Deep-dive on product issues with engineering
3. Success team to conduct health check
The second alert is actually usable. It provides context, urgency, specific actions, and easy response mechanisms.
2.5 Aligning Analytics with Business Objectives and OKRs
Here's a dirty secret: most analytics teams have no idea which business objectives their work supports.
Ask an analytics team what they're working on and you'll hear about dashboards, models, data pipelines, and reporting requests. Ask them which strategic business objectives those support and you'll get vague answers about "improving decision-making" or "enabling data-driven culture." This is backwards.
Starting with Business Objectives
Analytics work should start with business objectives, not data availability or technical capabilities.
The Right Sequence:
1.
Business Objective:
What is the company trying to achieve? (Revenue growth, margin expansion, customer retention)
2.
Key Results:
How will we measure success? (Specific, measurable targets)
3.
Critical Decisions:
Which decisions most impact these key results?
4.
Decision Requirements:
What information or predictions would improve these decisions?
5.
Analytics Solutions:
What data, models, and systems deliver those requirements?
The Wrong Sequence (Common):
1. We have lots of data
2. Let's analyze it
3. Let's build dashboards showing interesting patterns
4. Let's present insights to stakeholders
5. Hope someone finds it useful
The OKR Framework for Analytics
If your organization uses OKRs (Objectives and Key Results), analytics initiatives should map directly to them.
Example: E-Commerce Company
Business Objective: Increase repeat purchase rate
Key Results:
- KR1: Increase 90-day repeat rate from 25% to 35%
- KR2: Increase customer lifetime value (CLV) by 40%
- KR3: Reduce customer acquisition cost (CAC) by 20%
Analytics Initiatives Mapped to Key Results:
Supporting KR1 (Repeat Purchase Rate):
- Build propensity-to-repurchase model
- Design personalized re-engagement campaigns
- Create next-best-product recommendation engine
- Implement win-back program for churned customers
Supporting KR2 (Customer Lifetime Value):
- Develop CLV prediction model by customer segment
- Optimize onboarding experience to increase early activation
- Create retention risk model to trigger proactive interventions
- Design premium tier offering targeted at high-CLV customers
Supporting KR3 (Customer Acquisition Cost):
- Build marketing attribution model to identify efficient channels
- Develop lookalike modeling to improve audience targeting
- Create propensity scoring for lead quality
- Implement dynamic bidding optimization
Notice every analytics initiative has a clear line of sight to a business outcome. This isn't analytics for analytics' sake—it's analytics in service of specific business goals.
The Prioritization Question
Analytics teams face infinite demand and finite capacity. How do you prioritize?
Most teams prioritize by: - Whoever screams loudest (the squeaky wheel approach) - Executive requests (the "whoever has the most power" approach) - Interesting technical problems (the "cool factor" approach) - Requests in the order received (the "first come, first served" approach)
Smart teams prioritize by: - Business Impact: Which decisions have the largest effect on key results? - Decision Frequency: How often is this decision made? (High frequency = more aggregate impact) - Current Decision Quality: How suboptimal is the current decision process? - Feasibility: Can we actually build this with available data and reasonable effort?
The simple prioritization formula:
Priority Score = (Business Impact × Decision Frequency × Improvement Potential) / Implementation Effort
This forces honest conversations about impact, not just activity.
2.6 Measuring the Impact of Analytics Initiatives
Now for the uncomfortable part: proving analytics actually matters.
The Measurement Crisis
Most analytics teams cannot answer this simple question: "How much value did your team create last year?"
They can tell you: - How many dashboards they built - How many reports they delivered - How many models they deployed - How many queries they answered
These are activity metrics , not impact metrics. They measure what the team did, not what changed because of it.
Activity ≠ Impact
The Three Levels of Analytics Measurement
Level 1: Activity Metrics (What most teams measure) - Dashboards created - Reports delivered - Models deployed - Projects completed - User satisfaction scores
These tell you nothing about business value. They're necessary for operational management but insufficient for demonstrating impact.
Level 2: Usage Metrics (Better, but still insufficient) - Dashboard views - Report opens - Model prediction requests - Active users
These tell you if anyone is using your analytics, but not if it's creating value. A dashboard can be viewed a thousand times and change zero decisions.
Level 3: Impact Metrics (The only ones that actually matter) - Decisions changed - Outcomes improved - Value created (revenue, cost savings, risk reduction)
This is hard to measure, which is why most teams don't do it. But it's the only measurement that matters.

DIAGRAM 4: Analytics Impact Measurement Framework This comprehensive framework shows how to measure analytics impact across four dimensions: 1) The measurement hierarchy (why impact metrics matter more than activity metrics), 2) Different measurement approaches and when to use each, 3) A comparison of two organizations showing that high activity doesn't equal high impact, 4) The different types of value analytics can create (revenue generation, cost reduction, risk mitigation, quality improvement).
How to Actually Measure Analytics Impact
Let's get specific about measurement approaches:
Approach 1: A/B Testing (The Gold Standard)
Method: Compare outcomes between groups that did and didn't use the analytics
Example: Credit Approval Model - Control Group: Applications decided using traditional underwriting rules - Test Group: Applications decided using predictive model - Measured Outcomes: - Approval rate - Default rate - Revenue per application - Processing time
Calculated Impact: Difference in outcomes × volume = total value created
This is the cleanest measurement approach but requires ability to randomize, which isn't always feasible.
Approach 2: Before-After Comparison (Second Best)
Method: Compare outcomes before and after analytics implementation
Example: Dynamic Pricing System - Before: Static pricing updated quarterly - After: Dynamic pricing updated daily - Measured Outcomes: - Revenue - Margin - Sales volume - Competitive price positioning
Challenges: Must account for other factors that changed (seasonality, market conditions, etc.)
Improvement: Use control categories (products without dynamic pricing) to isolate the effect
Approach 3: Decision Quality Assessment (When Outcomes Are Delayed)
Method: Evaluate decision quality improvement even if final outcomes aren't known yet
Example: Hiring Model - Before: Resume screening by recruiters (measure false positive and false negative rates) - After: AI-assisted screening (measure improved accuracy) - Proxy Metrics: Interview-to-offer ratio, quality of hire (manager ratings), new hire retention
This requires validating that your intermediate metrics actually predict final outcomes.
Approach 4: Process Efficiency Gains (For Cost-Focused Analytics)
Method: Measure time or cost saved through automation or improved decision-making
Example: Automated Invoice Processing - Before: Manual processing, 15 minutes per invoice - After: Automated extraction and routing, 2 minutes per invoice - Volume: 100,000 invoices per year - Labor Cost:
50/hourfullyloaded−AnnualSavings:(13minutes×100,000× 50/60) = $1.08M
This is straightforward for automation projects but be honest about actual time savings (people often claim savings that don't materialize).
The Analytics Value Dashboard
The Dashboard That Matters
If you're going to build one dashboard for your analytics team, make it the impact dashboard:
Metrics to Track: 1. Total Value Created: Sum of measured impact across all initiatives ($ value) 2. Value by Initiative: Which projects created the most value? 3. Value by Type: Revenue generation vs. cost reduction vs. risk mitigation 4. ROI by Project: Value created / cost to develop and maintain 5. Decisions Automated: Number of decisions moved from manual to automated 6. Decision Velocity: Time from data availability to action taken 7. Model Performance: Prediction accuracy, drift, retraining frequency
This dashboard shows whether your analytics team is creating value or just creating reports.
The Uncomfortable Accountability Question
If your analytics initiatives aren't creating measurable value, you have three options:
- Fix the measurement problem: Maybe you are creating value but not measuring it properly
- Fix the analytics: Maybe your analytics isn't embedded in decision workflows
- Stop doing those analytics: Maybe you're working on things that don't matter
Most teams need to do #2. Some need to do #3. Very few have only problem #1.
Key Takeaways
Let's be brutally clear about what this chapter argues:
- Analytics must be embedded in workflows, not separate from them. If your analytics sits outside the operational decision-making process, it's decorative.
- The value of analytics is measured by decisions changed, not analyses produced. Activity metrics (dashboards built, reports delivered) are vanity metrics. Impact metrics (outcomes improved, value created) are what matter.
- Operational decisions create more value than strategic decisions in aggregate. The hundreds of daily decisions about pricing, inventory, approvals, routing, and targeting matter more than the handful of strategic decisions executives obsess over.
- Dashboards are the weakest form of analytics. Automate where you can. Alert where you must. Report only what's left.
- Most analytics initiatives fail at the point of action, not analysis. The gap between insight and action is where value goes to die.
- Analytics teams must align with business objectives and prove their impact. If you can't draw a straight line from your analytics work to business outcomes, you're probably doing the wrong work.
- The best analytics is invisible. When analytics is truly embedded, it becomes the operating system, not a reporting layer. Users don't think "I need to check the dashboard"—the analytics just makes their work better.
Exercises
Exercise 1: Map Analytics Opportunities in End-to-End Processes
Objective: Identify where analytics can create value in a core business process
Instructions: 1. Choose one end-to-end process (Order-to-Cash, Procure-to-Pay, Hire-to-Retire, etc.) 2. Map the process end-to-end with major steps 3. Identify every decision point in the process 4. For each decision point, answer: - How is this decision currently made? - What data could improve this decision? - What would the decision look like if analytics were fully embedded? - What's the frequency and business impact of this decision? 5. Prioritize analytics opportunities using impact × frequency
Deliverable: Process map with decision points marked, current vs. ideal state described, top 3 opportunities identified
Exercise 2: Design a Decision Workflow
Objective: Create a complete decision workflow from trigger to feedback loop
Instructions: 1. Select one recurring operational decision (inventory reorder, credit approval, marketing offer, etc.) 2. Design the complete decision workflow including: - Trigger: What initiates the decision? - Data: What information is needed? (Be specific about sources) - Decision Logic: How should the decision be made? (Rules, models, optimization) - Action: What happens? (Automated, recommended, or decision support) - Feedback: How do we measure and improve? 3. Specify: - Current state (how it works today) - Future state (how it should work with embedded analytics) - Expected impact (quantify if possible) - Implementation requirements (data, systems, skills)
Deliverable: Detailed decision workflow diagram with current state, future state, and impact estimate
Exercise 3: Create Functional KPIs and Metrics
Objective: Define a metrics hierarchy that drives action, not just reporting
Instructions: 1. Choose one functional area (Marketing, Operations, Finance, HR) 2. Identify the top business objective for that function 3. Define 3-5 Key Results that measure success 4. For each Key Result, identify: - Outcome Metrics: The results we care about (lagging indicators) - Driver Metrics: What causes the outcomes (leading indicators) - Action Metrics: What decisions or actions move the drivers 5. For each metric, specify: - How it's calculated - What decisions it informs - Who owns the metric - How often it's measured 6. Map metrics to decisions: which metrics inform which decisions?
Deliverable: - Metrics hierarchy (Objectives → Key Results → Driver Metrics → Action Metrics) - Metrics definition table with calculation, decision, owner, frequency - Decision-to-metrics mapping
Example Structure:
|
Metric |
Type |
Calculation |
Informs Decision |
Owner |
Frequency |
|
Customer Retention Rate |
Outcome |
(Customers at end - new) / Customers at start |
Retention strategy, product roadmap |
Chief Customer Officer |
Monthly |
|
Net Promoter Score |
Driver |
% Promoters - % Detractors |
Customer experience priorities |
VP Customer Experience |
Weekly |
|
Average Resolution Time |
Action |
Avg time from ticket open to close |
Support staffing, training needs |
Support Manager |
Daily |
What's Next
This chapter established how analytics must be embedded in business processes and decision workflows to create value. We've seen that the best analytics is invisible—it becomes the operating system, not a reporting layer.
But we've been vague about one critical thing: what actually goes into building these analytics solutions? How do you move from business problem to working analytical system?
That's what the rest of this book addresses: the methods, tools, and approaches for building analytics that actually matters. Not analytics theater, but analytics that changes decisions and creates measurable value.
The next chapter dives into the first critical skill: understanding and defining the right problem to solve. Because the best analytics in the world is worthless if you're solving the wrong problem.